Charts Dashboard
To configure a RunMyProcess dashboard with pie and column charts, we'll use Google Visualisation for chart rendering, and as source of data RunMyProcess reports feeds.
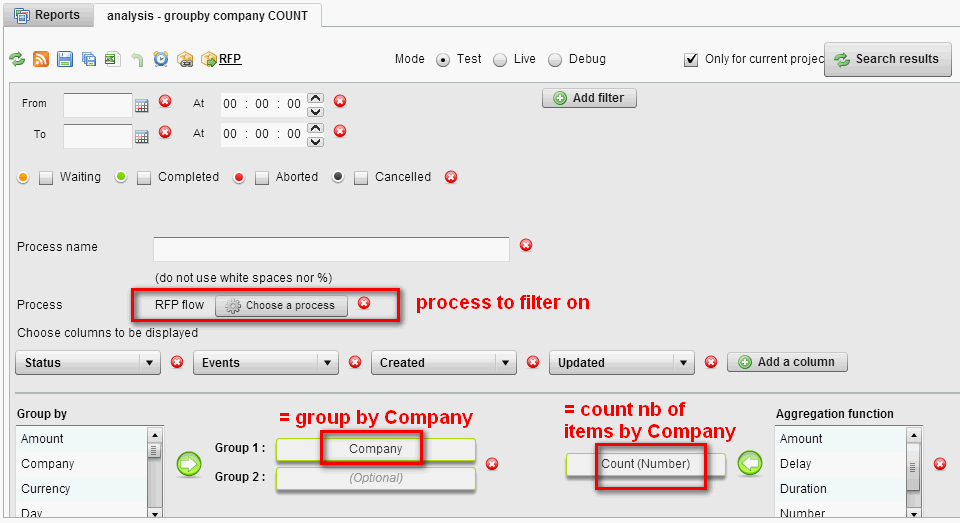
You already have several process instances on your account. Let's create a groupby report corresponding to the PieChart to be displayed.
In this example, the main process is 'RFP flow' with a set of measures including 'Company'.
To create a groupby process report to display Nb of RFP by Company:
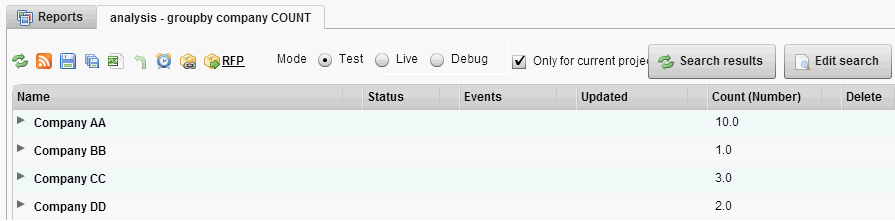
- Then hit 'search result' to display data:
- Then click on rss feed
 , this should display rss feed url + feed data in a new tab:
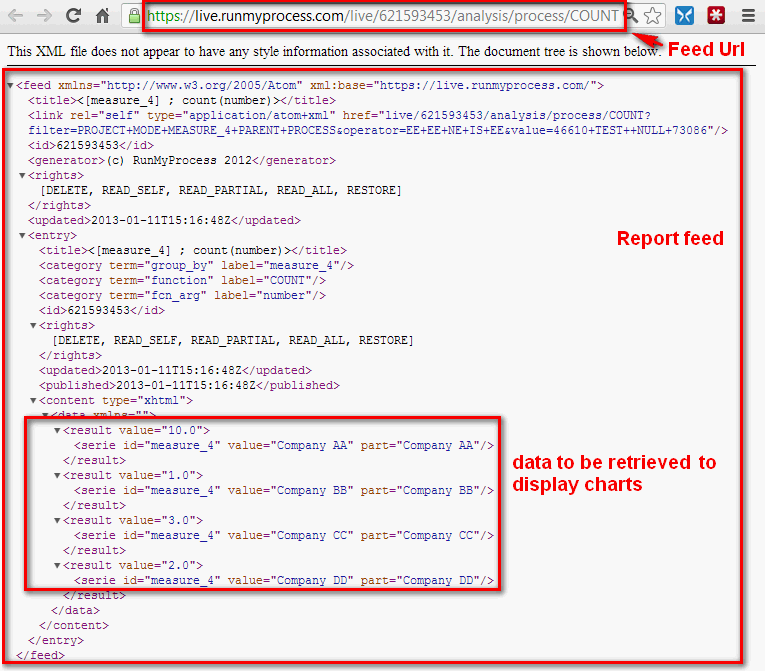
- Your feed url should look like:
https://live.runmyprocess.com/live/621593453/analysis/process/COUNT? field=NUMBER&group=MEASURE_4&operator=EE%20EE%20NE%20IS%20EE&value=46610%20TEST%20%20NULL %2073086&filter=PROJECT%20MODE%20MEASURE_4%20PARENT%20PROCESS
- As you can see, it contains all the filters you've configured. Do try to open in a new tab this url adding &media=json at the end:
https://live.runmyprocess.com/live/621593453/analysis/process/COUNT? field=NUMBER&group=MEASURE_4&operator=EE%20EE%20NE%20IS%20EE&value=46610%20TEST%20%20NULL %2073086&filter=PROJECT%20MODE%20MEASURE_4%20PARENT%20PROCESS&media=json
Let's give this url the name json_report_feed_url
- This should display the same feed with json output (instead of xml output):
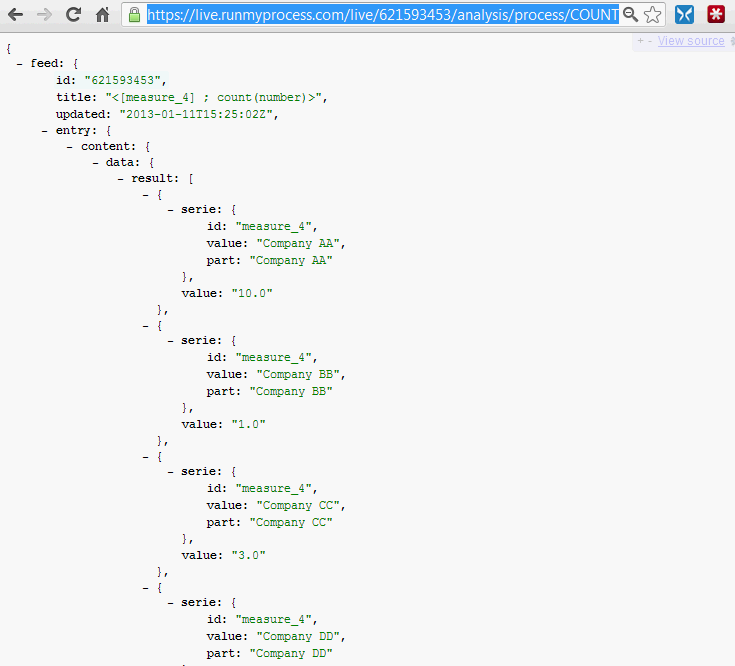
Note: if you are a Chrome user, you can use JSONView plugin to pretty print json feed
Now you have your source of data, let's create the webinterface to display the dashboard containing the PieChart
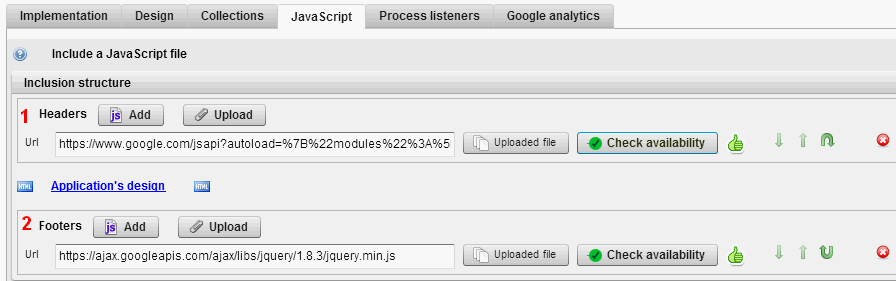
(1) Insert as HEADER the google visualisation library
| https://www.google.com/jsapi?
autoload=%7B%22modules%22%3A%5B%7B%22name%22%3A%22visualization%22%2C%22version%22%3A%221%22%2C%22packages%22%3A%5B%22corechart%22%5D%7D%5D%7D
|
(2) Insert as FOOTER the jQuery library to perform AJAX calls:
| https://ajax.googleapis.com/ajax/libs/jquery/3.4.1/jquery.min.js
|
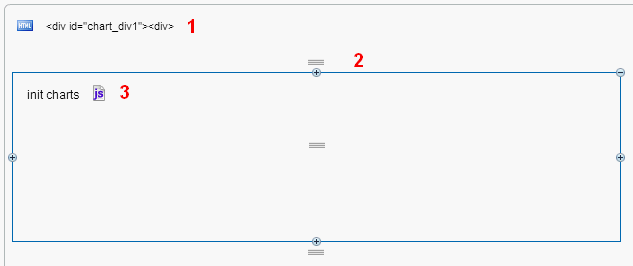
(1) Create a html widget with following code:
Code
| <div id="chart_div1"><div>
|
This is the html area to display the PieChart.
(2) Create a hidden split widget
(3) Create a js widget with following code:
Code
1
2
3
4
5
6
7
8
9
10
11
12
13
14
15
16
17
18
19
20
21
22
23
24
25
26
27
28
29
30
31
32
33
34
35
36
37
38
39
40
41
42
43
44
45
46
47
48
49
50
51
52
53
54
55
56
57
58
59
60
61
62
63
64
65
66
67
68
69
70
71
72
73
74
75
76
77
78
79
80
81
82
83
84
85 | //Handle 0,1 or several records from report feed
function get_array(my_father, my_son) {
if (typeof(my_father) == "object") {
if (my_father[my_son] != undefined) {
if (my_father[my_son].length != undefined) {
var my_array = my_father[my_son];
} else {
var my_array = [my_father[my_son]];
}
} else {
var my_array = [];
}
} else {
var my_array = [];
}
return my_array;
}
//Display a PieChart
function drawPieChart(html_id, array_data, array_column, chart_title, chart_width, chart_height) {
// Create our data table.
var data = new google.visualization.DataTable();
for (i = 0; i < array_column.length; i++) {
data.addColumn(array_column[i].type, array_column[i].title);
}
var array_array_data = new Array();
for (i = 0; i < array_data.length; i++) {
array_array_data.push([array_data[i].label, array_data[i].value]);
}
data.addRows(array_array_data);
// Instantiate and draw our chart, passing in some options.
var chart = new google.visualization.PieChart(document.getElementById(html_id));
chart.draw(data, {
width : chart_width,
height : chart_height,
is3D : true,
title : chart_title
});
}
//Get report feed and then render the PieChart 1
function draw_Pie1() {
$.ajax({
type : "GET",
url : "json_report_feed_url",
data : {},
cache : false,
async : true,
dataType : "json",
error : function () {
alert('Error while loading credits.');
},
success : function (P_result) {
var array_column = [{
"type" : "string",
"title" : "Company"
}, {
"type" : "number",
"title" : "Nb RFP"
}
];
var my_entries = get_array(P_result.feed.entry.content.data, "result");
var array_data = new Array();
for (var i = 0; i < my_entries.length; i++) {
array_data.push({
"label" : my_entries[i].serie.value,
"value" : parseFloat(my_entries[i].value)
});
}
//alert(JSON.stringify(array_data));
var html_id = "chart_div1";
var chart_title = "Nb of RFP by Company";
var chart_width = 0;
var chart_height = 240;
drawPieChart(html_id, array_data, array_column, chart_title, chart_width, chart_height);
}
});
}
//init charts
draw_Pie1();
|
In red, the code to replace:
Save your webinterface and preview it.
Note: Every chart will need its associated chart_divXX id to be diplayed.
Note2: To create another PieChart, it's just about adding another draw_Pie2() function and include another chart_div2 html div.
Other charts: embed a ColumnChart
Column chart can be displayed using the same data feed. You just need a group by report as for the PieChart.
To render a ColumnChart you can add the 2 following functions to previous script:
Code
 1
 2
 3
 4
 5
 6
 7
 8
 9
10
11
12
13
14
15
16
17
18
19
20
21
22
23
24
25
26
27
28
29
30
31
32
33
34
35
36
37
38
39
40
41
42
43
44
45
46
47
48
49
50
51
52
53
54
55
56
57
58
59
60
61
62 | //Display a ColumnChart
function drawColumnChart(html_id, array_data, array_column, chart_title, chart_width, chart_height) {
// Create our data table.
var data = new google.visualization.DataTable();
for (i = 0; i < array_column.length; i++) {
data.addColumn(array_column[i].type, array_column[i].title);
}
var array_array_data = new Array();
for (i = 0; i < array_data.length; i++) {
array_array_data.push([array_data[i].label, array_data[i].value]);
}
data.addRows(array_array_data);
// Instantiate and draw our chart, passing in some options.
var chart = new google.visualization.ColumnChart(document.getElementById(html_id));
chart.draw(data, {
width : chart_width,
height : chart_height,
is3D : true,
title : chart_title
});
}
//Get report feed and then render the ColumnChart 2
function draw_ColumnChart2() {
$.ajax({
type : "GET",
url : "json_report_feed_url2",
data : {},
cache : false,
async : true,
dataType : "json",
error : function () {
alert('Error while loading credits.');
},
success : function (P_result) {
var array_column = [{
"type" : "string",
"title" : "Company"
}, {
"type" : "number",
"title" : "RFP amount"
}
];
var my_entries = get_array(P_result.feed.entry.content.data, "result");
var array_data = new Array();
for (var i = 0; i < my_entries.length; i++) {
array_data.push({
"label" : my_entries[i].serie.value,
"value" : parseFloat(my_entries[i].value)
});
}
//alert(JSON.stringify(array_data));
var html_id = "chart_div2";
var chart_title = "RFP amount by Company";
var chart_width = 0;
var chart_height = 240;
drawColumnChart(html_id, array_data, array_column, chart_title, chart_width, chart_height);
}
});
}
|
The same red code has to be replaced.
To both render PieChart & ColumnChart:
Code
| //init
draw_Pie1();
draw_ColumnChart2();
|
Enjoy!!
Please give details of the problem