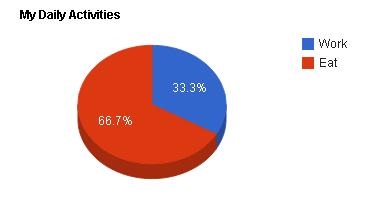
Static Pie Chart: Understand Google Visualization
Create a pie chart
How to configure it:
-
Create a new RMP user interface
-
Include this as a
.jsin the headers of your webform (this is a google library with pie chart package)https://www.google.com/jsapi?autoload=%7B%22modules%22%3A%5B%7B%22name%22%3A%22visualization%22%2C%22version%22%3A%221%22%2C%22packages%22%3A%5B%22corechart%22%5D%7D%5D%7D -
Add an html widget with the following code :
Code
1 | |
- Add a calculated gadget in your RMP webform with this script :
Code
1 2 3 4 5 6 7 8 9 10 11 12 13 14 15 16 17 18 19 20 21 22 23 24 25 26 27 28 29 30 31 32 33 34 | |
- Save your webform, switch to test mode and preview!
You can now adapt this feature to your own data source : you just have to compute array_column and array_data (thanks to a RunMyProcess process listener for example) and call this js function
This is the best way of designing your dashboards within RunMyProcess webforms.
NB : This feature doesn't requires working in a google environment as this is not a google gadget
For more documentation on the other google visualisations : https://developers.google.com/chart/interactive/docs/
Please give details of the problem