Representation of a Web Interfaces report
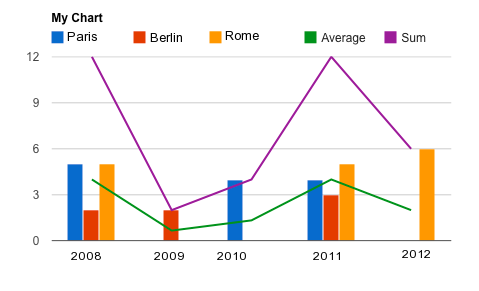
The screenshot below is an example of a 3D chart with the average and the sum option on. Data source is a webinterface report.
How to configure it:
1. Create a new web interface report
Configure this report to display your custom measures as columns.
2. Create a new web interface
3. Include the Google Charts Library and JQuery in the web interface
Include these two files in the headers of your webform :
https://www.google.com/jsapi?autoload=%7B%22modules%22%3A%5B%7B%22name%22%3A%22visualization%22%2C%22version%22%3A%221%22%2C%22packages%22%3A%5B%22corechart%22%5D%7D%5D%7D
https://ajax.googleapis.com/ajax/libs/jquery/3.4.1/jquery.js
The html widget should contain the following code
| <div id="chart_div"><div>
|
This code uses the measures "MEASURE_1" and "MEASURE_2" of your report, make sure that these measures are available in your web interface report.
Do not forget to modify the report URL in the script. To find the "report_url" of your web interface report, open your web interface report, click on the ![RSS feed icon] (/images/feed.png) and
copy the URL of the page that has just opened. The other parameters you can customize are in bold in the script.
  1
  2
  3
  4
  5
  6
  7
  8
  9
 10
 11
 12
 13
 14
 15
 16
 17
 18
 19
 20
 21
 22
 23
 24
 25
 26
 27
 28
 29
 30
 31
 32
 33
 34
 35
 36
 37
 38
 39
 40
 41
 42
 43
 44
 45
 46
 47
 48
 49
 50
 51
 52
 53
 54
 55
 56
 57
 58
 59
 60
 61
 62
 63
 64
 65
 66
 67
 68
 69
 70
 71
 72
 73
 74
 75
 76
 77
 78
 79
 80
 81
 82
 83
 84
 85
 86
 87
 88
 89
 90
 91
 92
 93
 94
 95
 96
 97
 98
 99
100
101
102
103
104
105
106
107
108
109
110
111
112
113
114
115
116
117
118
119
120
121
122
123
124
125
126
127
128
129
130
131
132
133
134
135
136
137
138
139
140
141
142
143
144
145
146
147
148
149
150
151
152
153
154
155
156
157
158
159
160
161
162
163
164
165
166
167
168
169
170
171
172
173
174
175
176
177
178 | /* Technical settings */
var report_url="https://live.runmyprocess.com/live/${customer_id}/applistate?nb=0&YYYYYY"; /*IMPORTANT: TO MODIFY*/
var html_id="chart_div"; /*id of the HTML widget in which you want to display your chart*/
/* Visual settings */
var chart_title="My Chart"; /*Use the empty string if you do not want a title on your chart */
var chart_height=300;
var chart_width=600;
var average_label="Average"; /*label of the average, displayed only in a 3D chart with the average option is on (in the functional settings)*/
var sum_label="Sum"; /*label of the sum, displayed only in a 3D chart with the average option is on (in the functional settings)*/
var police_size=12; /*police size of the legend*/
/* Functional settings */
var chart_type="Column"; /*options are Bar, Column or Pie*/
var chart_dimensions=3; /*2 or 3. With a pie chart you cannot display 3 dimensions*/
var x_axis_measure_index="1"; /*x axis measure index*/
var y_axis_measure_index="2"; /*y axis measure index, not mandatory if chart dimension = 2 */
var stacked=false; /*if chart dimensions = 3, do you want to display the 2nd measure on one or many columns?*/
var average=true; /*display the average line. Only works with 3D charts*/
var sum=true; /*display the sum line. Only works with 3D charts*/
function get_array (my_father,my_son) {
if (typeof(my_father) == "object") {
if (my_father[my_son] != undefined) {
if (my_father[my_son].length != undefined) {
var my_array = my_father[my_son];
}
else {
var my_array = [my_father[my_son]];
}
}
else {
var my_array = [];
}
}
else {
var my_array = [];
}
return my_array;
}
$.ajax({
type:"GET"
,url: report_url
,data:{}
,cache:false
,async: true
,dataType: "json"
,error: function(){alert('Error while loading credits.');}
,success: function(P_result) {
var report_data = get_array(P_result.feed,"category");
var myentries = get_array(P_result.feed,"entry");
for(var q=0; q<report_data.length; q++){
if(report_data[q].term=="attribute"){
if(report_data[q].scheme=="attribute:"+x_axis_measure_index+":string:MEASURE_"+x_axis_measure_index){
var x_axis_label=report_data[q].label;
}
}
}
var array_data = new Array();
array_data.push([x_axis_label]);
if(chart_dimensions==2){
array_data[0].push("Number");
}
for(var i=0;i<myentries.length;i++){
var measure_1_exists=false;
var measure_2_exists=false;
var measure_1_value="";
var measure_2_value="";
for(var j = 0; j<myentries[i].category.length; j++){
if(myentries[i].category[j].term=="MEASURE_"+x_axis_measure_index){
var measure_1_value=myentries[i].category[j].label;
}
else if(chart_dimensions==3){
if(myentries[i].category[j].term=="MEASURE_"+y_axis_measure_index){
var measure_2_value=myentries[i].category[j].label;
}
}
}
for(var n=1; n<array_data.length; n++){
if(array_data[n][0]==measure_1_value){
var measure_1_exists=true;
var measure_1_index=n;
break;
}
}
if(chart_dimensions==3){
for(var k = 0; k<array_data[0].length; k++){
if(measure_2_value==array_data[0][k]){
var measure_2_exists=true;
var measure_2_index=k;
break;
}
}
}
if(!measure_1_exists){
var value=[];
value.push(measure_1_value);
for(var o=1; o<array_data[0].length; o++){
value.push(0);
}
if(chart_dimensions==2){
value[1]=1;
}
array_data.push(value);
measure_1_index=array_data.length-1;
}
else{
if(chart_dimensions==2){
array_data[measure_1_index][1]=array_data[measure_1_index][1]+1;
}
}
if(chart_dimensions==3){
if(measure_2_exists){
array_data[measure_1_index][measure_2_index]=array_data[measure_1_index][measure_2_index]+1;
}
else{
array_data[0].push(measure_2_value);
for(var m=1; m<array_data.length; m++){
if(m==measure_1_index){
array_data[m].push(1);
}
else{
array_data[m].push(0);
}
}
}
}
}
var options= {
width: chart_width,
height: chart_height,
is3D: true,
title: chart_title,
isStacked: stacked,
legend:{position: 'top',textStyle:{fontSize: police_size}},
};
if((average || sum) && chart_dimensions==3){
var nb_series=array_data[0].length-1;
if(average){
array_data[0].push(average_label);
}
if(sum){
array_data[0].push(sum_label);
}
for(var r=1; r<array_data.length; r++){
var sum_row=0;
for(var s=1; s<nb_series+1; s++){
sum_row=sum_row+array_data[r][s];
}
if(average){
var average_row=sum_row/(nb_series);
array_data[r].push(average_row);
}
if(sum){
array_data[r].push(sum_row);
}
}
json_series='{'+nb_series+' :{"type":"line"},'+(nb_series+1)+' :{"type":"line"}}';
json_series=eval('('+json_series+')');
options.seriesType="bars";
options.series=json_series;
}
var data = google.visualization.arrayToDataTable(array_data);
var chart = eval('new google.visualization.'+chart_type+'Chart(document.getElementById(html_id));');
chart.draw(data, options);
}
});
|
Please give details of the problem