How to use Google Tables
-
Create a new RMP user interface
-
Include this as a
.jsin the header of your webform (this is a google library with table chart package)
https://www.google.com/jsapi?autoload=%7B%22modules%22%3A%5B%7B%22name%22%3A%22visualization%22%2C%22version%22%3A%221%22%2C%22packages%22%3A%5B%22table%22%5D%7D%5D%7D -
Add an html widget with the following code :
Code
1 | |
- Add a javascript gadget in your RMP webform with this script :
Code
1 2 3 4 5 6 7 8 9 10 11 12 13 14 15 16 17 18 19 20 21 22 23 24 25 26 27 28 29 30 31 32 33 34 35 36 37 38 39 40 41 42 43 44 45 46 47 48 49 | |
- Save your webform, switch to test mode and preview
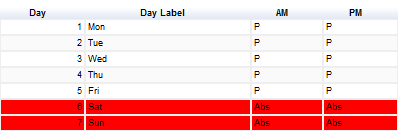
You can now adapt this feature to your own data source : you just have to compute array_column and array_data (from RunMyProcess Collections for example) and call this js function.
To highlight table rows according to your criteria, you have to modify the column and its value in getFilteredRows([{column: "column_number", value: "criteria_value"}]) function.
NB : This feature doesn't require working in a google environment as this is not a google gadget
For more information/properties about Google tables:https://developers.google.com/chart/interactive/docs/gallery/table
Please give details of the problem