How to use Google Tables
- Include the Google Table Chart library as a resource in your Web Interface
https://www.gstatic.com/charts/loader.js - Add an HTML widget with the following code:
Code
<div id="table_div"><div>
- Add the following code to your custom Javascript file:
Code
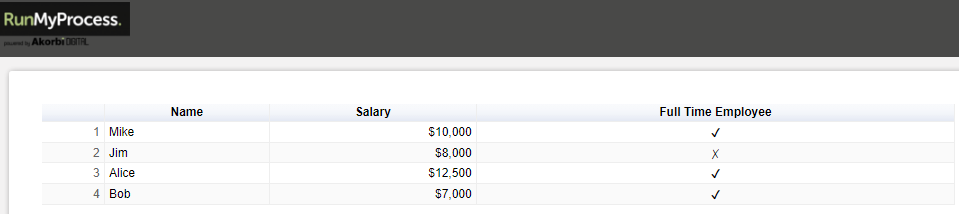
    google.charts.load('current', {'packages':['table']});
    google.charts.setOnLoadCallback(drawTable);

    function drawTable() {
        var data = new google.visualization.DataTable();
        data.addColumn('string', 'Name');
        data.addColumn('number', 'Salary');
        data.addColumn('boolean', 'Full Time Employee');
        data.addRows([
            ['Mike',  {v: 10000, f: '$10,000'}, true],
            ['Jim',   {v:8000,   f: '$8,000'},  false],
            ['Alice', {v: 12500, f: '$12,500'}, true],
            ['Bob',   {v: 7000,  f: '$7,000'},  true]
        ]);

        var table = new google.visualization.Table(document.getElementById('table_div'));

        table.draw(data, {showRowNumber: true, width: '100%', height: '100%'});
    }
- Save your web interface, switch to test mode, and preview
You can now adapt this feature to your own data source : you just have to compute array_column and array_data (from RunMyProcess Collections for example) and call this js function.
To highlight table rows according to your criteria, you have to modify the column and its value in getFilteredRows([{column: "column_number", value: "criteria_value"}]) function.
Nota : This feature doesn't require working in a google environment as this is not a google gadget
For more information/properties about Google tables:https://developers.google.com/chart/interactive/docs/gallery/table