Static Pie Chart: Understand Google Visualization
Create a pie chart
How to configure it:
-
Create a new RMP user interface
-
Include this as a
.jsin the headers of your webform (this is a google library with pie chart package)https://www.gstatic.com/charts/loader.js -
Add an html widget with the following code :
Code
<div id="chart_div"><div>
- Add a calculated gadget in your RMP webform with this script :
Code
// Load the Visualization API and the corechart package.
google.charts.load('current', {'packages':['corechart']});
// Set a callback to run when the Google Visualization API is loaded.
google.charts.setOnLoadCallback(drawChart);
// Callback that creates and populates a data table,
// instantiates the pie chart, passes in the data and
// draws it.
function drawChart() {
// Create the data table.
var data = new google.visualization.DataTable();
data.addColumn('string', 'Topping');
data.addColumn('number', 'Slices');
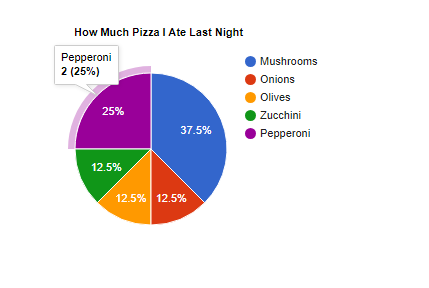
data.addRows([
['Mushrooms', 3],
['Onions', 1],
['Olives', 1],
['Zucchini', 1],
['Pepperoni', 2]
]);
// Set chart options
var options = {'title':'How Much Pizza I Ate Last Night',
'width':400,
'height':300};
// Instantiate and draw our chart, passing in some options.
var chart = new google.visualization.PieChart(document.getElementById('chart_div'));
chart.draw(data, options);
}
- Save your webform, switch to test mode and preview!
You can now adapt this feature to your own data source : you just have to compute array_column and array_data (thanks to a RunMyProcess process listener for example) and call this js function
This is the best way of designing your dashboards within RunMyProcess webforms.
This feature doesn't requires working in a google environment as this is not a google gadget
For more documentation on the other google visualisations : https://developers.google.com/chart/interactive/docs/