Representation of a Web Interfaces report
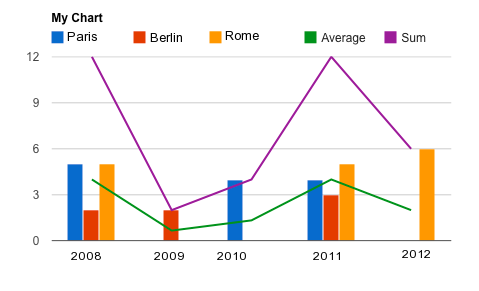
The screenshot below is an example of a 3D chart with the average and the sum option on. Data source is a webinterface report.
How to configure it:
1. Create a new web interface report
Configure this report to display your custom measures as columns.
2. Create a new web interface
3. Include the Google Charts Library and JQuery in the web interface
Include these two files in the headers of your webform :
4. Add an html widget in the web interface
The html widget should contain the following code
<div id="chart_div"><div>
5. Add a calculated gadget in your RMP webform with this script.
This code uses the measures "MEASURE_1" and "MEASURE_2" of your report, make sure that these measures are available in your web interface report.
Do not forget to modify the report URL in the script. To find the "report_url" of your web interface report, open your web interface report, click on the ![RSS feed icon] (/images/feed.png) and
copy the URL of the page that has just opened. The other parameters you can customize are in bold in the script.
/* Technical settings */
var report_url="https://live.runmyprocess.com/live/${customer_id}/applistate?nb=0&YYYYYY"; /*IMPORTANT: TO MODIFY*/
var html_id="chart_div"; /*id of the HTML widget in which you want to display your chart*/

/* Visual settings */
var chart_title="My Chart"; /*Use the empty string if you do not want a title on your chart */
var chart_height=300;
var chart_width=600;
var average_label="Average"; /*label of the average, displayed only in a 3D chart with the average option is on (in the functional settings)*/
var sum_label="Sum"; /*label of the sum, displayed only in a 3D chart with the average option is on (in the functional settings)*/
var police_size=12; /*police size of the legend*/

/* Functional settings */
var chart_type="Column"; /*options are Bar, Column or Pie*/
var chart_dimensions=3; /*2 or 3. With a pie chart you cannot display 3 dimensions*/
var x_axis_measure_index="1"; /*x axis measure index*/
var y_axis_measure_index="2"; /*y axis measure index, not mandatory if chart dimension = 2 */
var stacked=false; /*if chart dimensions = 3, do you want to display the 2nd measure on one or many columns?*/
var average=true; /*display the average line. Only works with 3D charts*/
var sum=true; /*display the sum line. Only works with 3D charts*/


function get_array (my_father,my_son) {
if (typeof(my_father) == "object") {
    if (my_father[my_son] != undefined) {
        if (my_father[my_son].length != undefined) {
            var my_array = my_father[my_son];
        }
        else {
            var my_array = [my_father[my_son]];
        }
    }
    else {
        var my_array = [];
    }
}
else {
    var my_array = [];
}
    return my_array;
}

$.ajax({
    type:"GET",
    url: report_url,
    data: {},
    cache: false,
    async: true,
    dataType: "json",
    error: function() {
        alert('Error while loading credits.');
    },
    success: function(P_result) {
        var report_data = get_array(P_result.feed,"category");
        var myentries =  get_array(P_result.feed,"entry");

        for(var q=0; q<report_data.length; q++) {
            if(report_data[q].term == "attribute") {
                if(report_data[q].scheme == "attribute:" + x_axis_measure_index + ":string:MEASURE_" + x_axis_measure_index) {
                    var x_axis_label = report_data[q].label;
                }
            }
        }

        var array_data = new Array();
        array_data.push([x_axis_label]);

        if(chart_dimensions == 2) {
            array_data[0].push("Number");
        }

        for(var i = 0; i < myentries.length; i++) {
            var measure_1_exists = false;
            var measure_2_exists = false;
            var measure_1_value = "";
            var measure_2_value = "";

            for(var j = 0; j < myentries[i].category.length; j++) {
                if(myentries[i].category[j].term == "MEASURE_" + x_axis_measure_index) {
                    var measure_1_value = myentries[i].category[j].label;
                }
                else if(chart_dimensions == 3) {
                    if(myentries[i].category[j].term == "MEASURE_" + y_axis_measure_index) {
                        var measure_2_value = myentries[i].category[j].label;
                    }
                }
            }
            for(var n = 1; n < array_data.length; n++) {
                if(array_data[n][0] == measure_1_value) {
                    var measure_1_exists = true;
                    var measure_1_index = n;
                    break;
                }
            }
            if(chart_dimensions==3){
                for(var k = 0; k<array_data[0].length; k++){
                    if(measure_2_value==array_data[0][k]){
                        var measure_2_exists=true;
                        var measure_2_index=k;
                        break;
                    }
                }
            }

            if(!measure_1_exists) {
                var value = [];
                value.push(measure_1_value);
                for(var o = 1; o < array_data[0].length; o++) {
                    value.push(0);
                }
                if(chart_dimensions == 2) {
                    value[1] = 1;
                }
                array_data.push(value);
                measure_1_index = array_data.length - 1;
            }
            else{
                if(chart_dimensions == 2) {
                    array_data[measure_1_index][1] = array_data[measure_1_index][1] + 1;
                }
            }

            if(chart_dimensions == 3) {
                if(measure_2_exists) {
                    array_data[measure_1_index][measure_2_index] = array_data[measure_1_index][measure_2_index] + 1;
                }
                else{
                    array_data[0].push(measure_2_value);
                    for(var m = 1; m < array_data.length; m++) {
                        if(m == measure_1_index) {
                            array_data[m].push(1);
                        }
                        else{
                            array_data[m].push(0);
                        }
                    }
                }
            }
        }

        var options = {
            width: chart_width,
            height: chart_height,
            is3D: true,
            title: chart_title,
            isStacked: stacked,
            legend: { position: 'top',textStyle: {fontSize: police_size} },
        };

        if((average || sum) && chart_dimensions == 3) {
            var nb_series = array_data[0].length - 1;

            if(average) { array_data[0].push(average_label); }

            if(sum){ array_data[0].push(sum_label); }

            for(var r = 1; r < array_data.length; r++) {
                var sum_row = 0;
                for(var s = 1; s < nb_series + 1; s++) {
                    sum_row = sum_row + array_data[r][s];
                }
                if(average){
                    var average_row = sum_row/(nb_series);
                    array_data[r].push(average_row);
                }
                if(sum){
                    array_data[r].push(sum_row);
                }
            }
            json_series = '{'+nb_series+' :{"type":"line"},'+(nb_series+1)+' :{"type":"line"}}';
            json_series = eval('('+json_series+')');
            options.seriesType = "bars";
            options.series = json_series;
        }

        var data = google.visualization.arrayToDataTable(array_data);
        var chart = eval('new google.visualization.'+chart_type+'Chart(document.getElementById(html_id));');

        chart.draw(data, options);
    }
});