Create a dashboard based on a collection
Introduction
Dashboards let you get a high level summary information about data. This tutorial will show how to create pie and column charts based on data stored within a RunMyProcess collection.
Practice
To configure a RunMyProcess dashboard with pie and column charts, we will use Google Visualisation for chart rendering, and a collection as source of data.
We will need this two predefined Javascript functions :
The drawPieChart function allows to draw a pie chart:
//Display a PieChart
function drawPieChart(html_id, array_data, array_column, chart_title, chart_width, chart_height) {
    // Create our data table.
    var data = new google.visualization.DataTable();
    for (i = 0; i < array_column.length; i++) {
        data.addColumn(array_column[i].type, array_column[i].title);
    }

    var array_array_data = new Array();
    for (i = 0; i < array_data.length; i++) {
        array_array_data.push([array_data[i].label, array_data[i].value]);
    }

    data.addRows(array_array_data);
    // Instantiate and draw our chart, passing in some options.
    var chart = new google.visualization.PieChart(document.getElementById(html_id));
    chart.draw(data, {
        width : chart_width,
        height : chart_height,
        is3D : true,
        title : chart_title,
        isStack : true
    });
}
The drawColumnChart function allows to draw a column chart:
//Display a ColumnChart
function drawColumnChart(html_id, array_data, array_column, chart_title, chart_width, chart_height, isMultiChart) {
    /*If The column chart is not multi columns*/
    if (!isMultiChart) {
        var data = new google.visualization.DataTable();
        for (i = 0; i < array_column.length; i++) {
            data.addColumn(array_column[i].type, array_column[i].title);
        }
        var array_array_data = new Array();
        for (i = 0; i < array_data.length; i++) {
            array_array_data.push([array_data[i].label, array_data[i].value]);
        }
        data.addRows(array_array_data);
    } else {
        var array_column_title = new Array();
        for (i = 0; i < array_column.length; i++) {
            array_column_title[i] = array_column[i].title;
        }

        var lastResultArray = new Array();
        lastResultArray.push(array_column_title);

        for (i = 0; i < array_data.length; i++) {
            var array_data_value = new Array();
            array_data_value.push(array_data[i].label);

            for (key in array_data[i].value) {
                array_data_value.push(array_data[i].value[key]);
            }
            lastResultArray.push(array_data_value);
        }
        var data = google.visualization.arrayToDataTable(lastResultArray);
    }

    var chart = new google.visualization.ColumnChart(document.getElementById(html_id));
    chart.draw(data, {
        width : chart_width,
        height : chart_height,
        is3D : true,
        title : chart_title,
        isStack : true
    });
}
Getting Started
This represents the content of my collection:
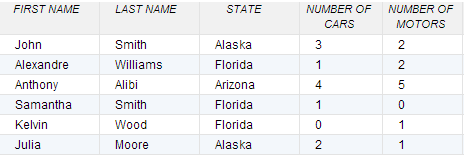
Let's assume that we want to display the number of cars per state. Therefore, we will use the aggregate function as follow:
function load_get_stats() {
    var pipelines = [{
                        "$group" : {
                            "_id" : {
                                "State" : "$state"
                            },
                            "Total" : {
                                "$sum" : "$nb_of_cars"
                            }
                        }
                        }, {
                        "$project" : {
                            "STATE" : "$_id.State",
                            "TOTAL" : "$Total"
                            }
                        }
                    ];
    col_my_collection.aggregateCallback(pipelines, {}, load_stats_ok, load_stats_ko);
}
The load_stats_ok function will pass aggregation result to both drawPieChart and drawColumnChart functions:
function load_stats_ok(result) {

    var array_data = new Array();
    for (var i = 0; i < result.length; i++) {
        array_data.push({
            "label" : result[i].STATE,
            "value" : parseInt(result[i].TOTAL)
        });
    }
    var array_column = [{
                            "type" : "string",
                            "title" : "State"
                            }, {
                            "type" : "number",
                            "title" : "Total Nb Of Cars"
                            }
                        ];

    var html_id_pie_chart = "chart_div2";
    var html_id_column_chart = "chart_div1";
    var chart_title = "Total Nb Of Cars";
    var chart_width = 0;
    var chart_height = 240;

    drawPieChart(html_id_pie_chart, array_data, array_column, chart_title, chart_width, chart_height);
    drawColumnChart(html_id_column_chart, array_data, array_column, chart_title, chart_width, chart_height, false);
}
The load_stats_ko function will pop up a message in case of error while loading data from the collection:
function load_stats_ko(result) {alert("ko "+JSON.stringify(result));}
Let's assume that we want to display the number of cars and the numbers of motors per state. Therefore, we will use the aggregate function as follow:
The load_stats_multi_chart function will retrieve data to be shown in the charts from the collection:
function load_stats_multi_chart() {

    var my_pipelines = [{
            "$group" : {
                "_id" : {
                    "State" : "$state"
                },
                "Total_Cars" : {
                    "$sum" : "$nb_of_cars"
                },
                "Total_Motors" : {
                    "$sum" : "$nb_of_motors"
                }
            }
            }, {
                "$project" : {
                    "state" : "$_id.State",
                    "TOTAL_CARS" : "$Total_Cars",
                    "TOTAL_MOTORS" : "$Total_Motors"
                }
            }
        ];

    col_my_collection.aggregateCallback(my_pipelines, {}, load_stats_multi_ok, load_stats_multi_ko);
}
The load_stats_multi_ok function will pass aggregation result to drawColumnChart function:
function load_stats_multi_ok(result) {

    var array_data_multi = new Array();
    var my_value = {};
    var value_array = new Array();
    for (var i = 0; i < result.length; i++) {
        my_value = {};
        my_value.TOTAL_CARS = parseInt(result[i].TOTAL_CARS);
        my_value.TOTAL_MOTORS = parseInt(result[i].TOTAL_MOTORS);
        value_array[i] = my_value;
    }

    for (var i = 0; i < result.length; i++) {
        array_data_multi.push({
        "label" : result[i].state,
        "value" : value_array[i]
        });
    }

    var array_column_multi = [{
                                "type" : "string",
                                "title" : "State"
                                }, {
                                "type" : "number",
                                "title" : "Total Nb Of Cars"
                                }, {
                                "type" : "number",
                                "title" : "Total Nb Of Motors"
                                }
                            ];

    var html_id = "chart_div3";
    var chart_title = "Total Nb Of Cars And Motors";
    var chart_width = 0;
    var chart_height = 240;

    drawColumnChart(html_id, array_data_multi, array_column_multi, chart_title, chart_width, chart_height, true);
}
The load_stats_multi_ko function will pop up a message in case of error while loading data from the collection:
function load_stats_multi_ko(result) {alert("ko "+JSON.stringify(result));}
Data Structure
The drawColumnChart function will take as input parameter an array with format as below:
- In case it's a Multi-Chart:
array_data structure will look like:
[{"label":"Arizona","value":{"TOTAL_CARS":4,"TOTAL_MOTORS":5}},
{"label":"Florida","value":{"TOTAL_CARS":2,"TOTAL_MOTORS":3}},
{"label":"Alaska","value":{"TOTAL_CARS":5,"TOTAL_MOTORS":3}}]
 ```

**array\_column** structure will look like:

```js
[{ "type" : "string", "title" : "State" },
    { "type" : "number", "title" : "Total Nb Of Cars" },
    { "type" : "number", "title" : "Total Nb Of Motors" }]
- In case it is not a Multi-Chart:
array_data structure will look like:
[{"label":"Arizona","value":4},
{"label":"Florida","value":2},
{"label":"Alaska","value":5}]
array_column structure will look like:
[{ "type" : "string", "title" : "State"},
    { "type" : "number", "title" : "Total Nb Of Cars"}]
The drawPieChart function will take the same format of input parameter as for drawColumnChart / non-Multi-Chart.
Important : The first column of column_array should have string as type. All other columns must have number as type.
Web Interface
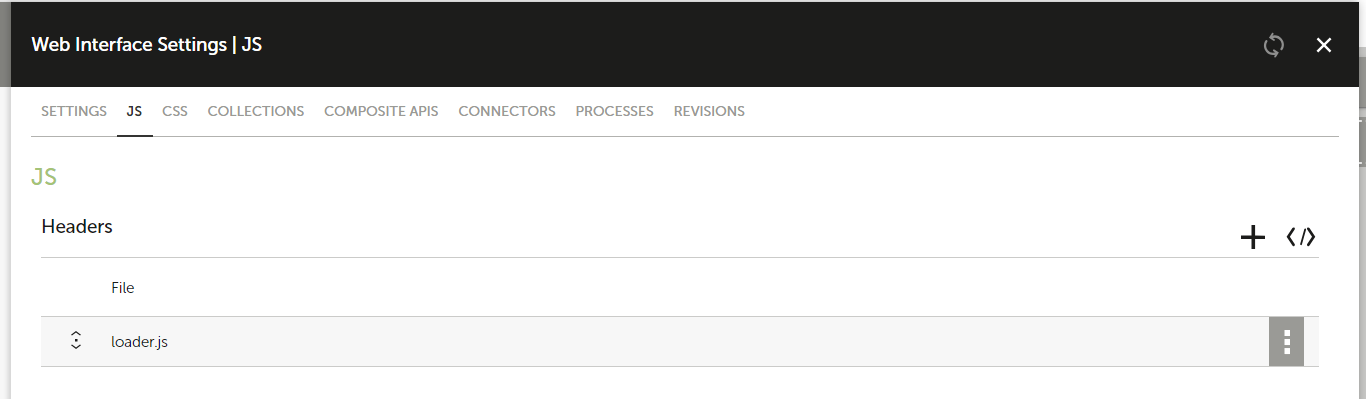
Since we have the definitions of the functions, let's create our Web Interface. - Create a new Web Interface, title 'Dashboard'. - Go to JavaScript tab - Insert as HEADER the Google visualization library:
https://www.gstatic.com/charts/loader.js
- Go to the Design tab:
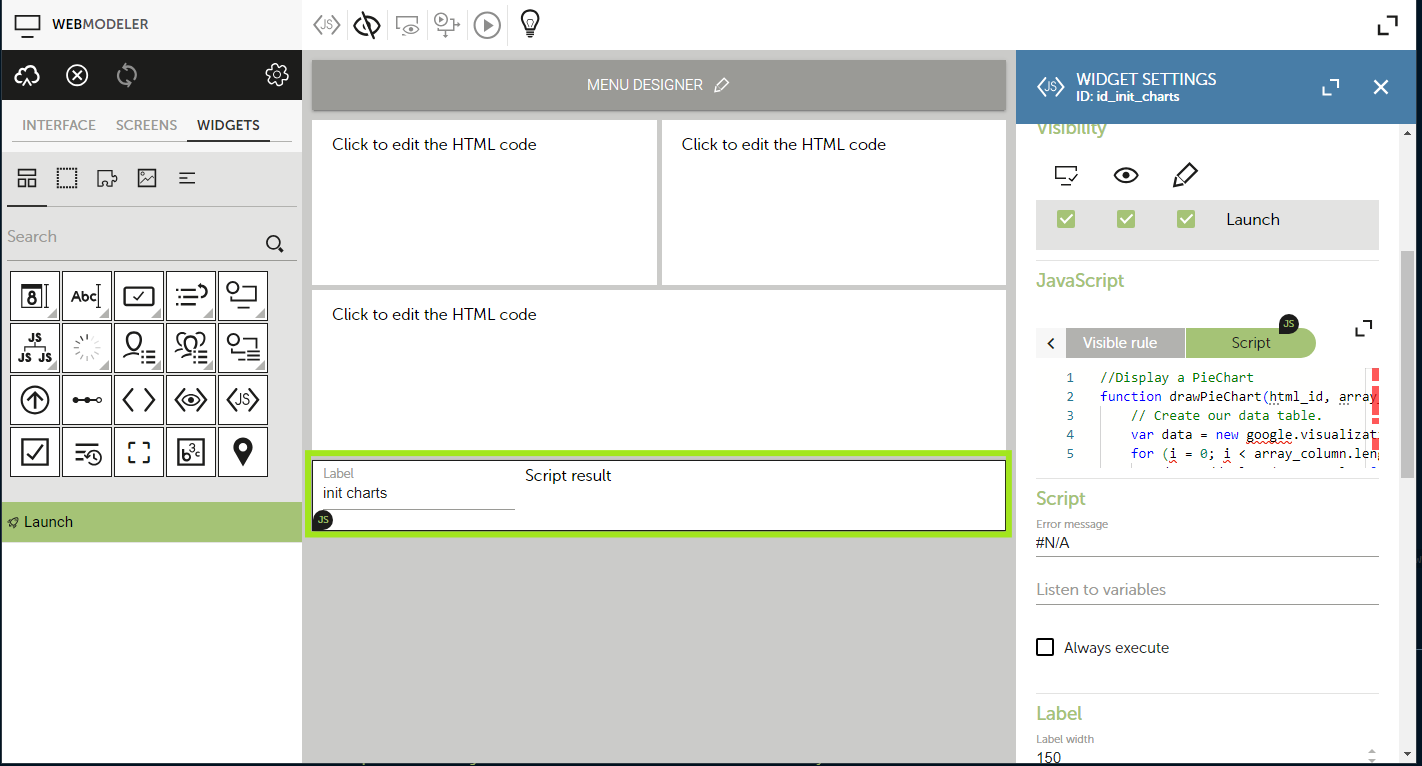
Create a HTML widget with following code:
<div id="chart_div1"><div>
Create a HTML widget with following code:
<div id="chart_div2"><div>
Create a HTML widget with following code:
<div id="chart_div3"><div>
Create a hidden split widget
Create a Javascript widget containing all of the functions described above.
This is the Javascript code to be used:
//Display a PieChart
function drawPieChart(html_id, array_data, array_column, chart_title, chart_width, chart_height) {
    // Create our data table.
    var data = new google.visualization.DataTable();
    for (i = 0; i < array_column.length; i++) {
        data.addColumn(array_column[i].type, array_column[i].title);
    }

    var array_array_data = new Array();
    for (i = 0; i < array_data.length; i++) {
        array_array_data.push([array_data[i].label, array_data[i].value]);
    }
    data.addRows(array_array_data);
    // Instantiate and draw our chart, passing in some options.
    var chart = new google.visualization.PieChart(document.getElementById(html_id));
    chart.draw(data, {
        width : chart_width,
        height : chart_height,
        is3D : true,
        title : chart_title,
        isStack : true
    });
}

//Display a ColumnChart
function drawColumnChart(html_id, array_data, array_column, chart_title, chart_width, chart_height, isMultiChart) {
    /*If The column chart is not multi columns*/
    if (!isMultiChart) {
        var data = new google.visualization.DataTable();
        for (i = 0; i < array_column.length; i++) {
            data.addColumn(array_column[i].type, array_column[i].title);
        }

        var array_array_data = new Array();
        for (i = 0; i < array_data.length; i++) {
            array_array_data.push([array_data[i].label, array_data[i].value]);
        }
        data.addRows(array_array_data);
    } else {
        var array_column_title = new Array();
        for (i = 0; i < array_column.length; i++) {
            array_column_title[i] = array_column[i].title;
        }

        var lastResultArray = new Array();
        lastResultArray.push(array_column_title);

        for (i = 0; i < array_data.length; i++) {
            var array_data_value = new Array();
            array_data_value.push(array_data[i].label);

            for (key in array_data[i].value) {
                array_data_value.push(array_data[i].value[key]);
            }
            lastResultArray.push(array_data_value);
        }

        var data = google.visualization.arrayToDataTable(lastResultArray);
    }

    var chart = new google.visualization.ColumnChart(document.getElementById(html_id));
        chart.draw(data, {
        width : chart_width,
        height : chart_height,
        is3D : true,
        title : chart_title,
        isStack : true
    });
}

function load_get_stats() {
    var pipelines = [{"$group":{"_id":{"State":"$state"},"Total":{"$sum":"$nb_of_cars"}}},{"$project":{"STATE":"$_id.State","TOTAL":"$Total"}}];
    col_my_collection.aggregateCallback(pipelines ,{},load_stats_ok,load_stats_ko);
}


function load_stats_ok(result){
        var array_data = new Array();
        for (var i = 0; i < result.length; i++) {
            array_data.push({"label":result[i].STATE,"value":parseInt(result[i].TOTAL)});
        }
        var array_column = [{ "type" : "string", "title" : "State" }, { "type" : "number", "title" : "Total Nb Of Cars" } ];

        var html_id_pie_chart = "chart_div2";
        var html_id_column_chart = "chart_div1";
        var chart_title = "Total Nb Of Cars";
        var chart_width = 0;
        var chart_height = 240;

        drawPieChart(html_id_pie_chart, array_data, array_column, chart_title, chart_width, chart_height);
        drawColumnChart(html_id_column_chart, array_data, array_column, chart_title, chart_width, chart_height,false);
}

function load_stats_ko(result) {alert("ko"+JSON.stringify(result));}

function load_stats_multi_chart() {

    var my_pipelines = [{"$group":{"_id":{"State":"$state"},"Total_Cars":{"$sum":"$nb_of_cars"},"Total_Motors":{"$sum":"$nb_of_motors"}}},{"$project":{"state":"$_id.State","TOTAL_CARS":"$Total_Cars","TOTAL_MOTORS":"$Total_Motors"}}];

    col_my_collection.aggregateCallback(my_pipelines, {}, load_stats_multi_ok, load_stats_multi_ko);
}
function load_stats_multi_ok(result){

    var array_data_multi = new Array();
    var my_value = {};
    var value_array = new Array();
    for (var i = 0; i < result.length; i++) {
    my_value = {};
    my_value.TOTAL_CARS = parseInt(result[i].TOTAL_CARS);
    my_value.TOTAL_MOTORS = parseInt(result[i].TOTAL_MOTORS);
    value_array[i] = my_value;
    }

    for (var i = 0; i < result.length; i++) {
    array_data_multi.push({"label":result[i].state,"value":value_array[i]});
    }

    var array_column_multi = [{ "type" : "string", "title" : "State" }, { "type" : "number", "title" : "Total Nb Of Cars" },{ "type" : "number", "title" : "Total Nb Of Motors" } ];

    var html_id = "chart_div3";
    var chart_title = "Total Nb Of Cars And Motors";
    var chart_width = 0;
    var chart_height = 240;

    drawColumnChart(html_id, array_data_multi, array_column_multi, chart_title, chart_width, chart_height, true);
}

function load_stats_multi_ko(result) {alert("ko"+JSON.stringify(result));}

load_get_stats();
load_stats_multi_chart();
Do note, you will have to replace the following parameters with your own values: - Charts labels/title - The value true/false in the drawColumnChart function will indicate if the data structure sent to the function represents a single column or an array of columns.
Save your Web Interface and preview it.
Note: Every chart will need its associated chart_divXX HTML div id to be displayed.