Web Interface Reports
A web interface report visualizes statistical and data-related information on web interface instances.
Creating a Web Interface Report
To create and configure a web interface report in the Resources or the Project Configuration module, you select the Web Interface Reports section on the Reports tab, and click Add.
You can configure the execution mode for your report, define filters, choose the columns to be included in the report, and group the report results as required.
A web interface report can be based on a web interface or on a process including all web interfaces related to it. Thus, you select the web interface or process the report is to be based on, and the status which is to be included or excluded.
Defining Filters
You can filter the web interface instances to be included in your report. The Add Filter button allows you to include only web interface instances that meet specific filter criteria depending on the parameters used. If you define more than one filter, they are combined by a logical AND.
If no web interface or process is selected as the basis for the report, you can filter it by the following parameters:
| Parameter | Description |
|---|---|
| Assigned or delegated to | Email address of the user the given web interface instance (manual task) is assigned or delegated to. |
| Was assigned or delegated to | Email address of the user the given web interface instance (manual task already completed) was assigned or delegated to. |
| Assigned to | Email address of the user the given web interface instance (manual task) is assigned to. |
| Delegated to | Email address of the user the given web interface instance (manual task) is delegated to. |
| Instance id | ID of the web interface instance. |
| Involved action | Action contained in the history of the web interface instance. Available actions: CREATE, SAVE, VALIDATE, CANCEL, and TIMEOUT. |
| Involved user | Email address of the user who modified the history of the web interface instance. |
| Modified by | Email address of the user who modified the web interface instance. |
| Name | Name of the web interface instance. |
| Started by | Email address of the user who launched the web interface instance. |
If you select a web interface or process as the basis for the report, you can also filter it by measures defined in the process which launches or is launched by a web interface involved. For details about measures, refer to Measures.
Operators
When defining filters in web interface reports, the available operators depend on the parameter type. These operators allow you to narrow down results by applying logical or textual conditions.
The following table lists the supported operators by parameter type:
| Parameter Type | Operators Available | Description | Performance Notes |
|---|---|---|---|
| Assigned or delegated to, Was assigned or delegated to | !=, =, Connected user, In, Not in |
Filters by user assignment or delegation. | Use = or In/Not in for efficiency. |
| Modified by | Connected user, Contains, Does not contain, In, Not in |
Filters based on who last modified the item. | Avoid Contains/Does not contain if possible. |
| Text (e.g., Name) | =, = (case-sensitive), !=, Contains, Does not contain, Begins with, Begins with (case-sensitive) |
String comparison operators. | ⚡ Prefer case-sensitive operators for faster execution. Avoid Contains. |
Performance Considerations for String Operators
-
Recommended: Use case-sensitive operators (
= (case-sensitive),Begins with (case-sensitive)). They leverage indexes efficiently. -
Avoid if possible: The
Containsoperator, since it performs a full substring search and may slow down large reports.
Note: You cannot combine case-sensitive filters with case-insensitive filters.
Choosing the Report Columns
If no web interface or process has been selected as the basis for the report, you can choose the following columns:
| Column | Description |
|---|---|
| Created | The last time the web interface instance was updated by a manual task. |
| Created since | The age of the web interface instance (in days), based on the creation date. |
| Day | Day when the web interface instance was launched. |
| Delegated to | User the web interface instance was delegated to. |
| Instance Id | Identifier of the web interface instance. |
| Modified by | Name of the user who has last accessed the web interface instance. |
| Month | Month when the web interface instance was launched. |
| On hold for | The number of days since the web interface has been waiting for a manual activity (the process is waiting for a manual task to be performed). |
| Screen | Name of the screen of the web interface. |
| Started by | Name of the user who has launched the web interface instance. |
| Year | Year when the web interface instance was launched. |
If a web interface or process has been selected as the basis for the report, you can also display the values of measures defined in the process you have selected or which is launched by the selected web interface. For details about measures, refer to Measures.
Grouping Report Results
You can choose fields to group the report results by. For example, grouping by Status will group all instances that have the same status. You can define two levels of grouping.
For Group 1, you can use aggregation functions to obtain specific summary information at group level. If a web interface or process has been selected, you can also perform arithmetic operations on measures of the corresponding process.
Displaying Report Results
To display the report results, you run the report. You can change the configuration or reset it by removing individual settings or clearing all settings.
The following image shows an example of a web interface report.
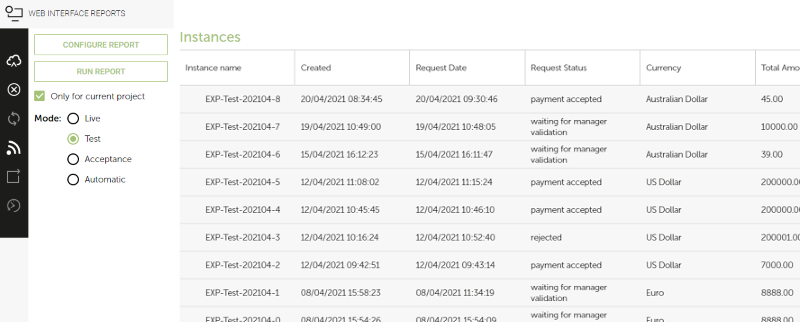
When you click a web interface instance in the list, it is started.
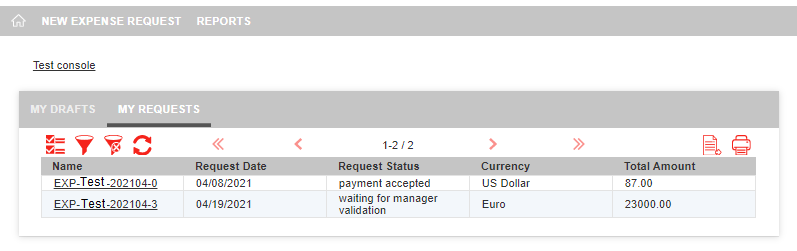
To present report results to end users, you can include web interface reports in a web interface using the Web Interface Report List widget or Web Interface Report widget. For details, refer to Widget Types.
The following example shows a web interface report embedded in a web interface via a Web Interface Report widget. It lists all tasks assigned to the logged in user. The user gets an overview of the status of her/his tasks, and can click on a task name to open it.
Exporting Report Data
You can export the report data to a CSV file by following these steps:
Export Options
1. Default Export:
- Click the Export button.
- Choose the Default option to export the data displayed on the current page.
- The file will be downloaded immediately.
2. Customized Export:
-
Select the Customize option to configure additional parameters, such as:
- Separator: Specify the delimiter used in the file.
- Charset: Choose the character encoding format.
- Charset: Choose the character encoding format.
- Decimal Separator: Define how decimals are represented.
- Date Format: Set the desired date format.
-
Choose the scope of the export:
- All Data
- Data with Filters Applied
- Selected Data
-
After configuring your options, an email will be sent with a download link once the file is ready.
Viewing Your Data in Microsoft Excel
To load and view the exported CSV file in Microsoft Excel:
- Open Microsoft Excel.
- Go to the Data tab and select From Text/CSV.
- Choose the CSV file you wish to open.
- Click Transform Data, then Close & Load to display the data in a formatted table.