Reports
Reports are a special type of project resource. They are not static building blocks of an application, but rather a means of monitoring and displaying application information at runtime.
DigitalSuite distinguishes between two types of report:
- Process reports list process requests. They are mainly used to obtain information on the status of process requests and monitor their execution. The execution path of each process request can be opened from a process report.
- Web interface reports list persistent web interface instances. They are typically used to provide users of applications with information on their tasks and requests.
Designers can create and configure any number of process and web interface reports. They can include them in web interfaces by means of the corresponding widgets in order to create and display the report results to end users at runtime. Using tools such as the Google Visualization API, process and web interface reports can be presented on dashboards and in charts of various types.
Report Identification
The following settings identify a report in DigitalSuite:
-
Name: The name of the report. The name should indicate the report's purpose and include important filters configured, for example,
Expense Requests - all,My tasks - auto, orRed Processes Since 2021-01-01 - live. -
ID: A generated number used to uniquely identify the report.
-
URL: A generated URL relative to the DigitalSuite base URL (
live.runmyprocess.com). The URL includes all the report criteria and can be used, for example, to execute the report from web interfaces or composite APIs.
Process Reports
Process reports are mainly used to obtain information on the status of process requests and monitor their execution.
Designers can configure process reports as needed using the following options:
- The project or projects whose process requests are to be included.
- The execution mode to which the report pertains, and which processes to consider in Live mode.
- Various filter criteria such as the process whose requests to include, the request status, the date the request was started or last updated, the user who launched or modified the request, step types or IDs, or events that occurred.
- The report columns with the information to be displayed. This may include standard information stored for each request and/or measures defined for a given process.
- Grouping of report results by given fields, including aggregation functions to provide specific summary information.
Process reports can be executed:
- Directly in DigitalSuite Studio.
- From a web interface through a Process Report widget.
- Using the Reporting API, for example, in a composite API.
The result of a process report is a list of process requests fulfilling the given criteria.
In DigitalSuite Studio, users with the appropriate permissions can open process requests from the report results to display their execution path and analyze errors that occurred in the Process Console.
Web Interface Reports
Web interface reports are typically used to provide users of applications with information on their tasks within processes and on process requests they have launched. Web interface reports can include any persistent web interface instances, i.e. instances which:
- Have launched a process request.
- Were launched by a process request, usually to complete a manual task.
- Include a Save as draft button which was clicked at least once.
- Include an Upload widget by which at least one file has been uploaded.
Designers can configure web interface reports as needed using the following options:
- The project or projects whose web interface instances are to be included.
- The execution mode to which the report pertains, and which web interface instances to consider in Live mode.
- Various filter criteria such as a specific web interface whose instances to include, a process whose related web interfaces to consider, the instance status or ID, a date since when the instances have been created or on hold, the user the manual tasks to be completed through the instances are assigned to, or specific actions carried out for the instances.
- The report columns with the information to be displayed. This may include standard information stored for each web interface instance and/or measures defined for the process whose related web interfaces are included in the report.
- Grouping of report results by given fields, including aggregation functions to provide specific summary information.
Web interface reports can be executed:
- Directly in DigitalSuite Studio.
- From a web interface through a Web Interface Report widget.
- Using the Reporting API, for example, in a composite API.
The result of a web interface report is a list of web interface instances fulfilling the given criteria.
In DigitalSuite Studio, users with the appropriate permissions can view web interface instances from the report results.
Report Visualization
DigitalSuite comes with visualization and rendering mechanisms to display process and web interface reports in web interfaces and DigitalSuite Studio.
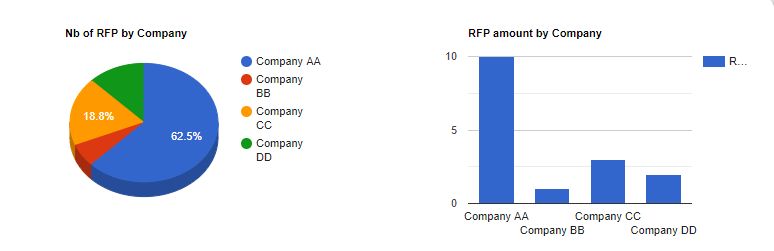
In addition, designers can use tools such as the Google Visualization API to present process and web interface reports on dashboards and in charts of various types, for example: